Overview | Argoverse 1
Argoverse 1 is the first Argoverse release. It includes high-definition (HD) maps and two open-source autonomous driving datasets:
- Argoverse 1 3D Tracking Dataset: contains 3D tracking annotations for 113 scenes.
- Argoverse 1 Motion Forecasting Dataset: contains 324,557 interesting vehicle trajectories extracted from over 1,000 driving hours.
Terms of Use
We created Argoverse to support advancements in 3D tracking, motion forecasting, and other perception tasks for self-driving vehicles. We offer it free of charge under a creative commons share-alike license. Please visit our Terms of Use for details on licenses and all applicable terms and conditions.
Citation
In June 2019, we released the Argoverse 1 datasets to coincide with the appearance of our publication, Argoverse: 3D Tracking with Forecasting and Rich Maps, in CVPR 2019. When referencing this publication or any of the materials we provide, please use the following citation:
@INPROCEEDINGS { Argoverse,
  author = {Ming-Fang Chang and John W Lambert and Patsorn Sangkloy and Jagjeet Singh
       and Slawomir Bak and Andrew Hartnett and De Wang and Peter Carr
       and Simon Lucey and Deva Ramanan and James Hays},
  title = {Argoverse: 3D Tracking and Forecasting with Rich Maps},
  booktitle = {Conference on Computer Vision and Pattern Recognition (CVPR)},
  year = {2019}
}
Where was the data collected?
The data in Argoverse 1 comes from a subset of the area in which Argo AI’s self-driving test vehicles are operating in Miami and Pittsburgh — two US cities with distinct urban driving challenges and local driving habits. We include recordings of our sensor data, or "log segments," across different seasons, weather conditions, and times of day to provide a broad range of real-world driving scenarios.
Total lane coverage: 204 linear kilometers in Miami and 86 linear kilometers in Pittsburgh.
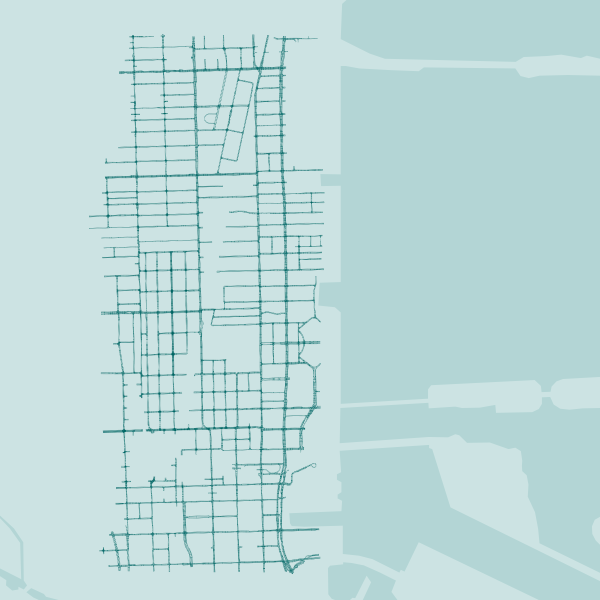
Miami
Beverly Terrace, Edgewater, Town Square
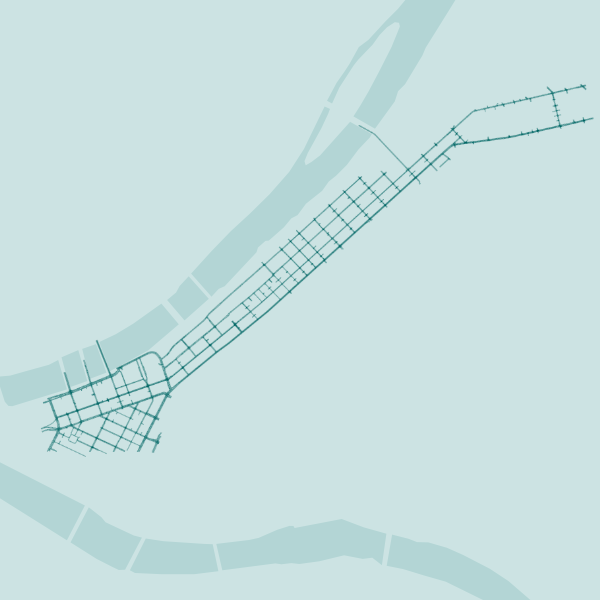
Pittsburgh
Downtown, Strip District, Lower Lawrenceville
How was the data collected?
We collected all of our data using a fleet of identical Ford Fusion Hybrids, fully integrated with Argo AI self-driving technology. We include data from two lidar sensors, seven ring cameras and two front-facing stereo cameras. All sensors are roof-mounted:
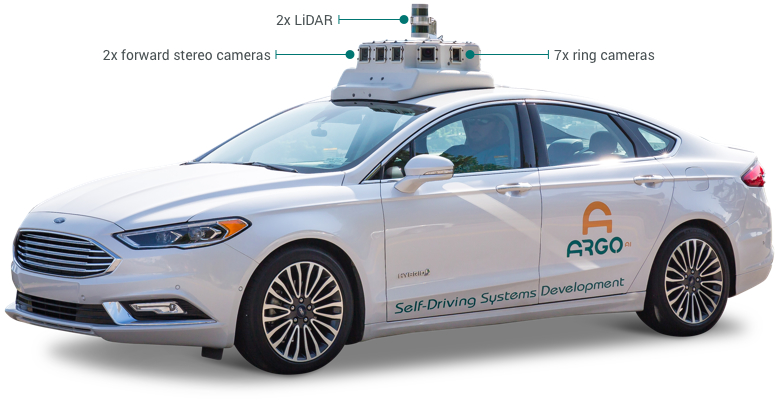
Lidar
- 2 roof-mounted lidar sensors
- Overlapping 40° vertical field of view
- Range of 200m
- On average, our lidar sensors produce a point cloud with ~ 107,000 points at 10 Hz
Localization
We use a city-specific coordinate system for vehicle localization. We include 6-DOF localization for each timestamp, from a combination of GPS-based and sensor-based localization methods.
Cameras
- Seven high-resolution ring cameras (1920 x 1200) recording at 30 Hz with a combined 360° field of view
- Two front-view facing stereo cameras (2056 x 2464) sampled at 5 Hz
Calibration
Sensor measurements for each driving session are stored in “logs.” For each log, we provide intrinsic and extrinsic calibration data for lidar and all nine cameras.
Argoverse 1 Maps
Our maps contain rich geometric and semantic metadata for better 3D scene understanding. From ground height to the distance remaining until the next intersection, our maps enable researchers to explore the potential of HD maps in robotic perception.
There are three distinct components that set our maps apart:
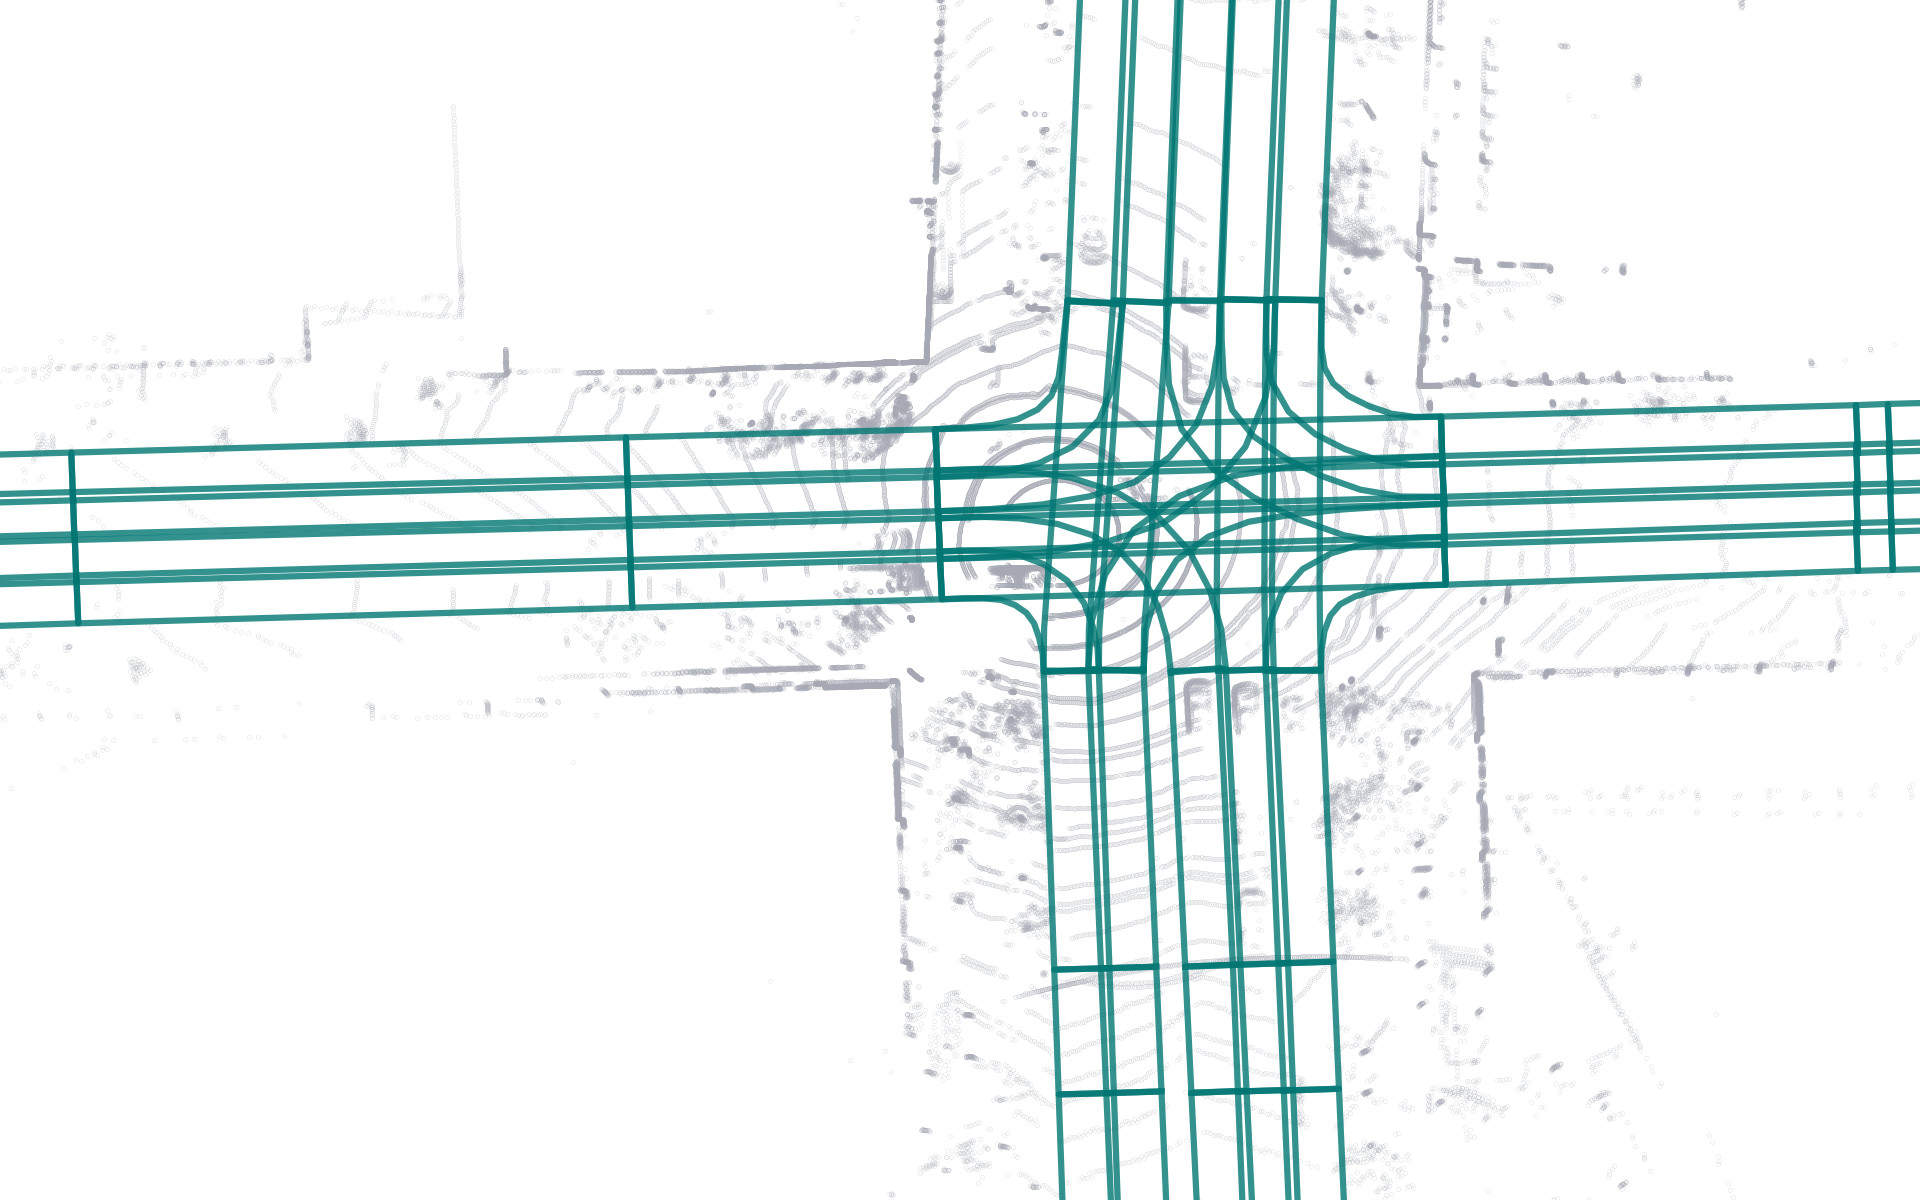
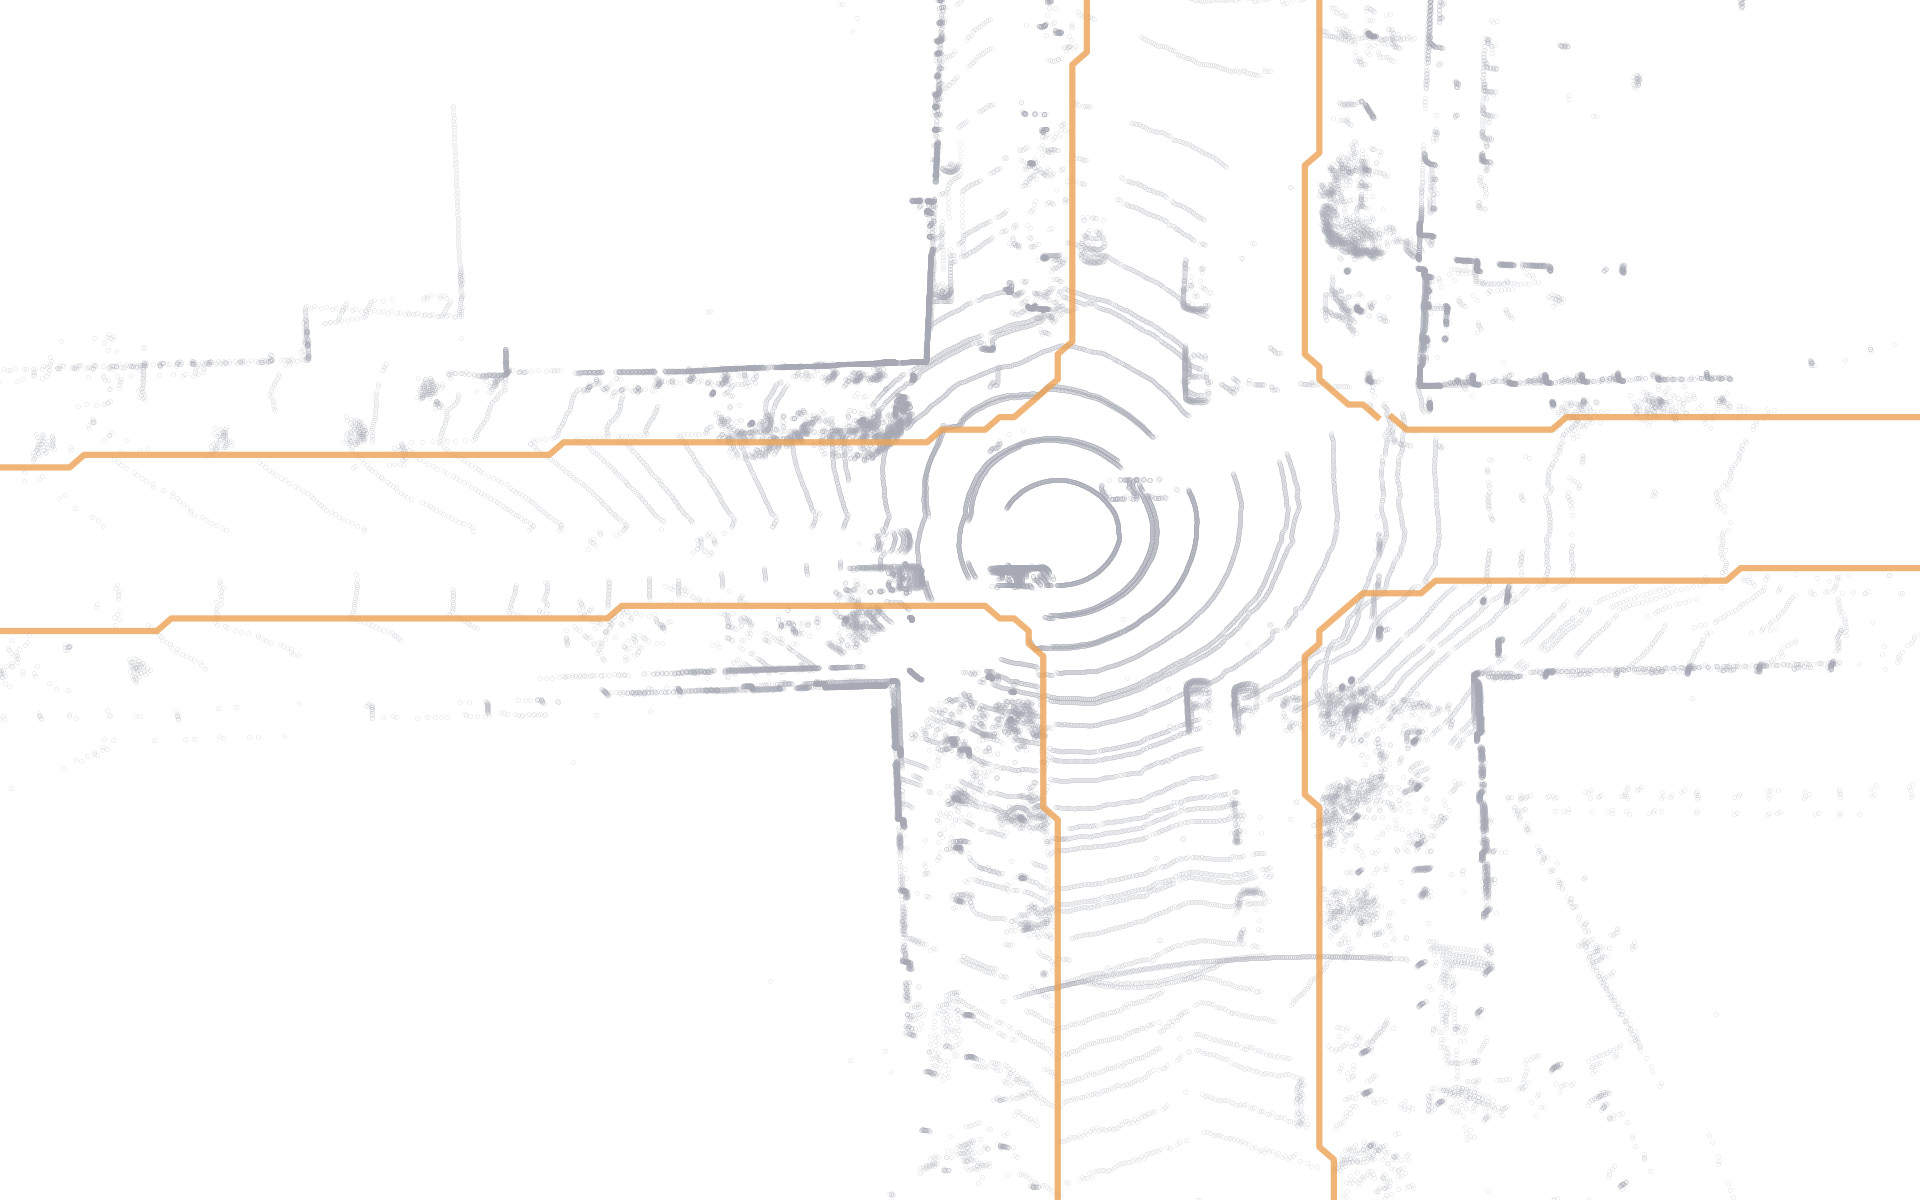
Vector Map: Lane-Level Geometry
Our semantic vector map conveys useful lane-level detail, such as lane centerlines, traffic direction, and intersection annotations. Through these features and more, users can explore the many ways traffic flows through city streets and complicated intersections in our test areas, and access a comprehensive picture of what comes before and after each scene.
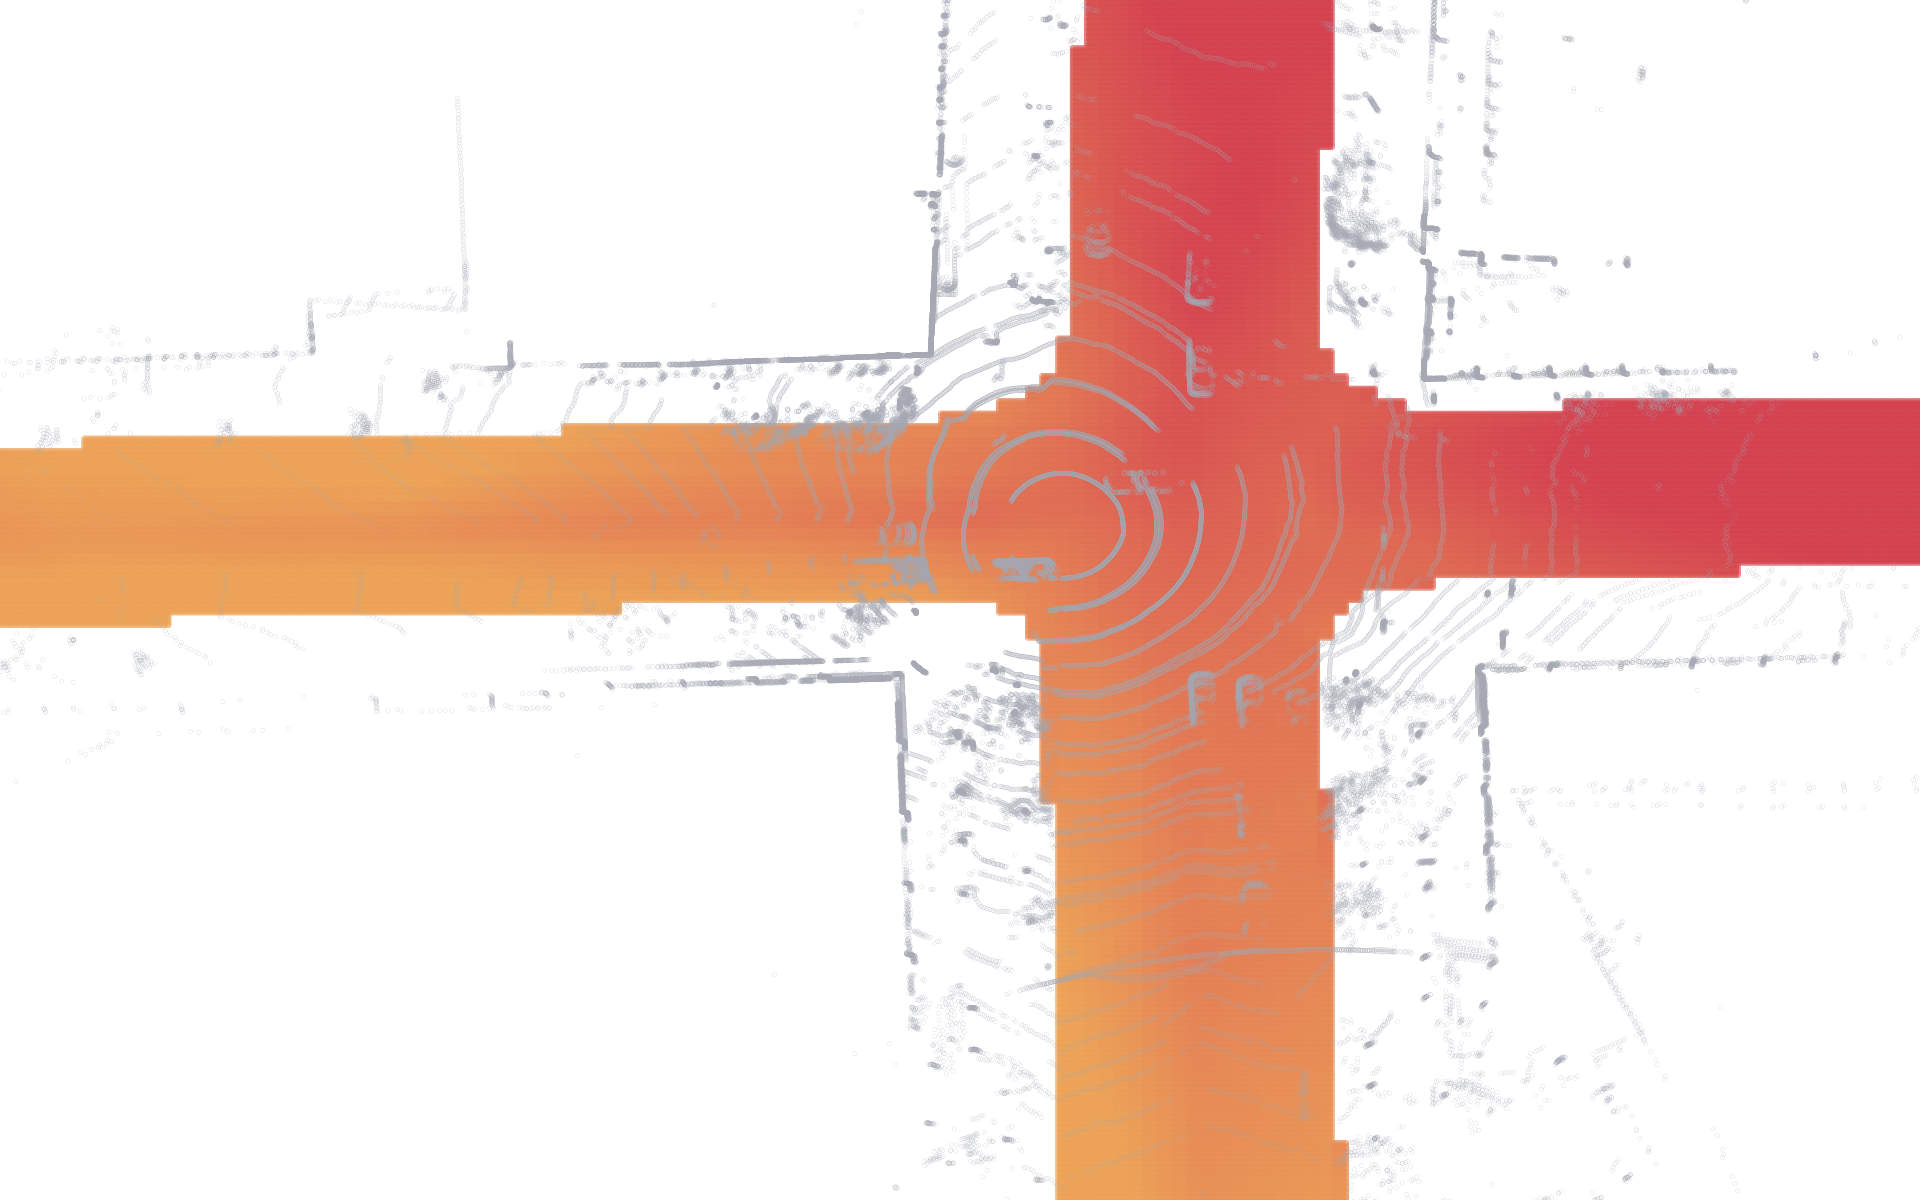
Rasterized Map: Drivable Area
Our maps include binary drivable area labels at one-meter grid resolution. A drivable area is an area in which it is possible for a vehicle to drive (though not necessarily legally). Our track annotations, outlined in 3D Tracking, extend to five meters beyond the drivable area. We call this larger area our "region of interest."
Rasterized Map: Ground Height
Our maps include real-valued ground height at one-meter resolution. With our map tools, users can remove lidar returns on uneven ground surfaces for easier object detection.
Argoverse 1 Map API
Our Map API enables users to more easily leverage our rich data and even take advantage of open source mapping tools built to handle OpenStreetMap formats.
We provide this API in Python and include a handful of useful functions, such as:
| Function Names | Description |
|---|---|
remove_non_driveable_area_points |
Use rasterized driveable area ROI to decimate lidar point cloud to only ROI points. |
remove_ground_surface |
Remove all 3D points within 30cm of the ground surface. |
get_ground_height_at_xy |
Get ground height at provided (x,y) coordinates. |
render_local_map_bev_cv2 |
Render a Bird's Eye View (BEV) in OpenCV. |
render_local_map_bev_mpl |
Render a Bird's Eye View (BEV) in Matplotlib. |
get_nearest_centerline |
Retrieve nearest lane center polyline. |
get_lane_direction |
Retrieve most probable tangent vector ∈ℝ² to lane centerline. |
get_semantic_label_of_lane |
Provide boolean values regarding the lane segment, including is_intersection_turn_direction, and has_traffic_control. |
get_lane_ids_in_xy_bbox |
Get all lane IDs with a Manhattan distance search radius in the xy plane. |
get_lane_segment_predecessor_ids |
Retrieve all lane IDs with an incoming edge into the query lane segment in the semantic graph. |
get_lane_segment_adjacent_ids |
Retrieve all lane IDs that are left or right neighbors of the query lane segment. |
get_lane_segment_centerline |
Retrieve polyline coordinates of query lane segment ID. |
get_lane_segment_polygon |
Hallucinate a lane polygon based around a centerline using average lane width. |
get_lane_segments_containing_xy |
Find lane IDs whose hallucinated lane polygons contain the query point. |
To download our maps, visit our downloads page.
To access our API, visit Argoverse 1 GitHub.
Argoverse 1 3D Tracking
A dataset to train and validate 3D tracking models
Argoverse 1 3D Tracking is a collection of 113 log segments with 3D object tracking annotations. These log segments, which we call “sequences,” vary in length from 15 to 30 seconds and collectively contain a total of 11,052 tracks.
Each sequence in our training and validation sets includes annotations for all objects within 5 meters of what we identify as the “drivable area” — the area in which it is possible for a vehicle to drive.
What makes this dataset stand out?
Users can build algorithms that take advantage of the detailed information in Argoverse's HD Maps. For example, an algorithm can use the map to perform ground removal on lidar returns or to constrain vehicle orientation based on lane direction.
Segment duration:
15-30 seconds
Total number of segments:
113
Total tracked objects:
11,052
Data Annotation
Argoverse 1 contains amodal 3D bounding cuboids on all objects of interest on or near the drivable area. By “amodal” we mean that the 3D extent of each cuboid represents the spatial extent of the object in 3D space — and not simply the extent of observed pixels or observed lidar returns, which is smaller for occluded objects and ambiguous for objects seen from only one face.
Our amodal annotations are automatically generated by fitting cuboids to each object’s lidar returns observed throughout an entire tracking sequence. If the full spatial extent of an object is ambiguous in one frame, information from previous or later frames can be used to constrain the shape. The size of amodal cuboids is fixed over time. A few objects in the dataset dynamically change size (e.g. a car opening a door) and cause imperfect amodal cuboid fit.
To create amodal cuboids, we identify the points that belong to each object at every timestep. This information, as well as the orientation of each object, come from human annotators.
We provide ground truth labels for 15 object classes. Two of these classes include static and dynamic objects that lie outside of the key categories we defined, and are called ON_ROAD_OBSTACLE and OTHER_MOVER. The distribution of these object classes across all of the annotated objects in Argoverse 3D Tracking looks like this:
For more information on our 3D tracking dataset, see our tutorial.
To download, visit our downloads page.
Argoverse 1 Stereo Dataset
A dataset to train and validate stereo depth estimation algorithms
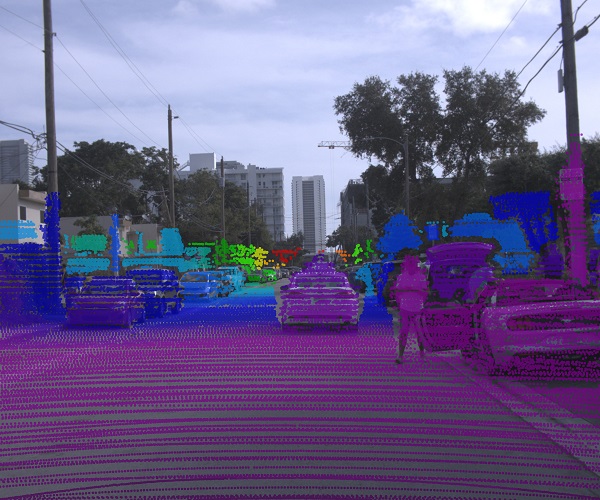
Ground truth depth overlaid with a stereo image
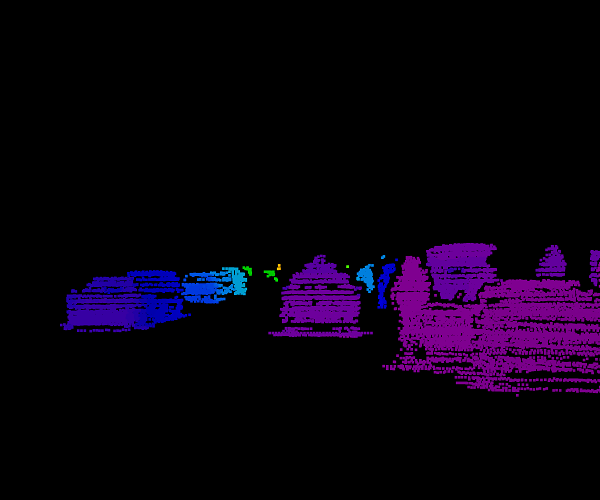
Depth for foreground objects
Argoverse 1 Stereo consists of rectified stereo images and ground truth disparity maps for 74 out of the 113 Argoverse 1 3D Tracking Sequences. The stereo images are (2056 x 2464 px) and sampled at 5 Hz. The dataset contains a total of 6,624 stereo pairs with ground truth depth, although we withhold the ground truth depth for the 15-sequence test set.
To create the ground truth depth, we use our recent scene flow method to accumulate lidar points from 11 frame sliding windows. We also manually refine the calibration and discard sequences with too many spurious lidar returns.
What makes this dataset stand out?
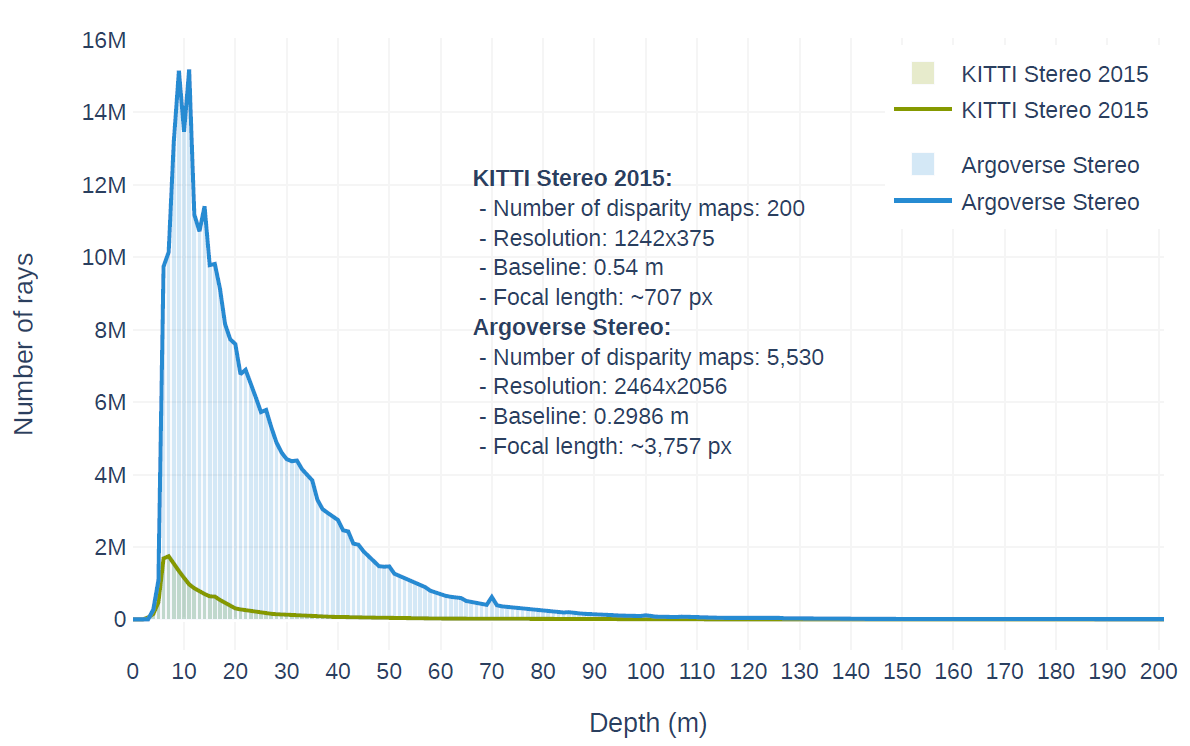
Inspired by the KITTI stereo benchmark, our stereo dataset has 16 times as many frames and features more diverse driving scenarios. We also accumulate depth differently by relying on non-rigid scene flow as opposed to vehicle CAD model fitting, which KITTI uses.
The Argoverse lidar range is up to 200 meters, roughly twice the range of the sensor used in the KITTI dataset, and our lidar produces a point cloud with greater density at each sweep. Therefore, our stereo dataset captures more scene details at the near and far range, crucial for autonomous vehicles.
Argoverse 1 Motion Forecasting Dataset
A dataset to train and validate motion forecasting models
Argoverse 1 Motion Forecasting is a curated collection of 324,557 scenarios, each 5 seconds long, for training and validation. Each scenario contains the 2D, birds-eye-view centroid of each tracked object sampled at 10 Hz.
To create this collection, we sifted through more than 1000 hours of driving data from our fleet of self-driving test vehicles to find the most challenging segments — including segments that show vehicles at intersections, vehicles taking left or right turns, and vehicles changing lanes.
What makes this dataset stand out?
This dataset is far larger than what can currently be mined from publicly available self-driving datasets, and our HD maps make it easier to predict the motion of objects.
Segment duration:
5 seconds
Total number of segments:
323,557
Total time:
320 hours
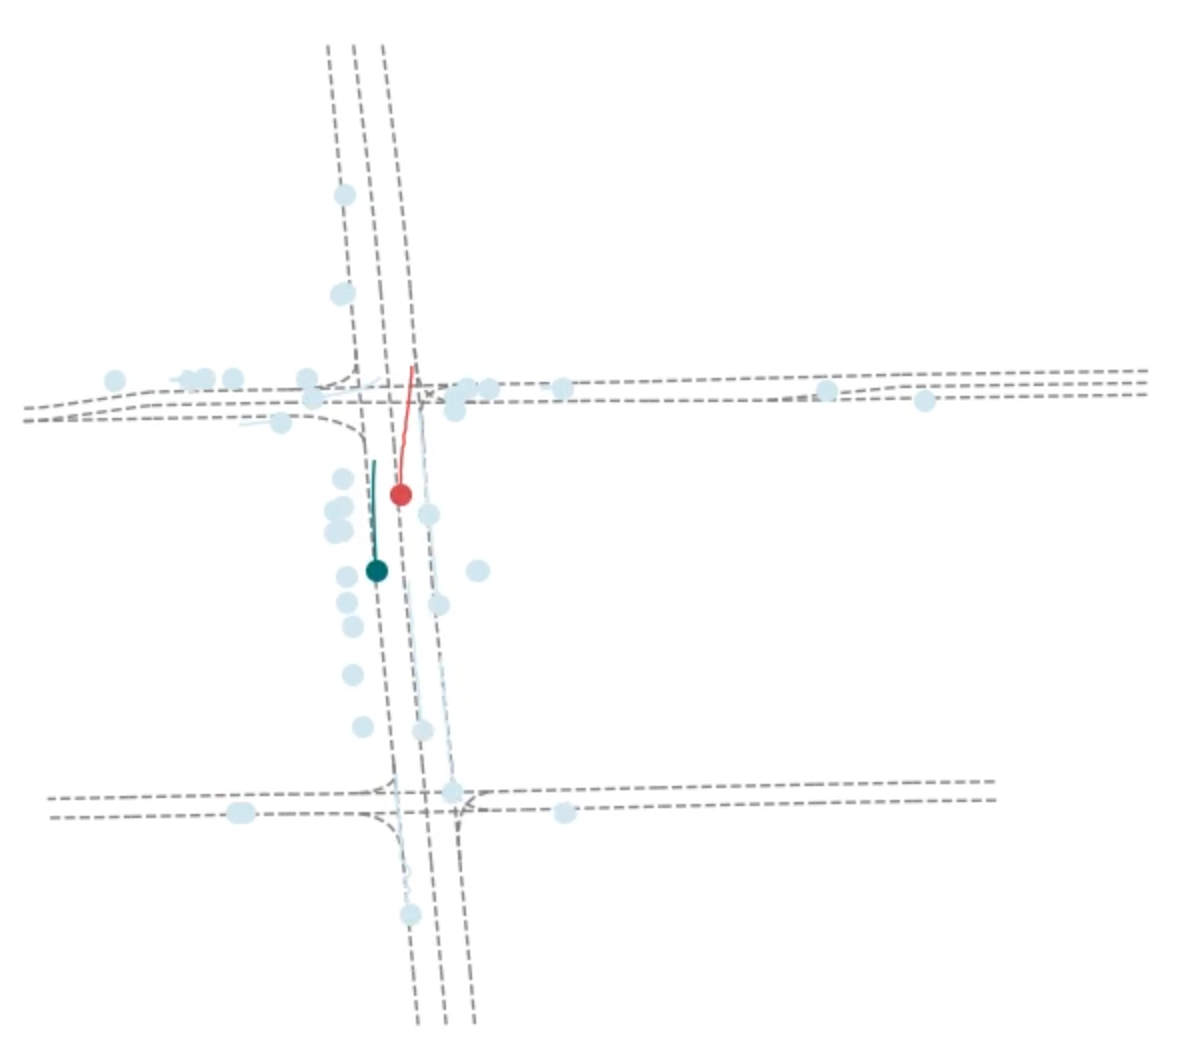
A still frame from one of the motion forecasting sequences, showing the trajectories for the agent of interest (red), self-driving vehicle (green), and all other objects of interest in the scene (light blue).
For more information on our Motion Forecasting dataset, see our tutorial.
To download, scroll down and select the Motion Forecasting dataset file.
Download Argoverse 1 Dataset. Get Started.
Argoverse 1 is provided free of charge under the Creative Commons Attribution-NonCommercial-ShareAlike 4.0 International Public license. Argoverse code and APIs are provided under the MIT license. Before downloading, please view our full Terms of Use.
Curious about the quality of our datasets? Sample one log from each. To get started, access our API and download our maps in the menu below.
Argoverse 1.1
October 2019: We’ve fixed 3D tracking annotations, improved stereo calibration, and removed some noisy forecasting scenarios. This new version of Argoverse is the basis for the Argoverse Competitions.
Sample Datasets v1.1
Argoverse HD Maps
Argoverse 3D Tracking v1.1
Argoverse Motion Forecasting v1.1
Argoverse Stereo v1.1
Argoverse 1.0 (deprecated)
We do not recommend using these files because they lack the fixes of Argoverse 1.1, but we preserve them for completeness.
Sample Datasets v1.0
- 3D Tracking warning: deprecated
- Motion Forecasting warning: deprecated
Argoverse HD Maps
Argoverse 3D Tracking v1.0
- Training Part 1 warning: deprecated
- Training Part 2 warning: deprecated
- Training Part 3 warning: deprecated
- Training Part 4 warning: deprecated
- Validation warning: deprecated
- Testing warning: deprecated
Argoverse Motion Forecasting v1.0
- Training warning: deprecated
- Validation warning: deprecated
- Testing warning: deprecated